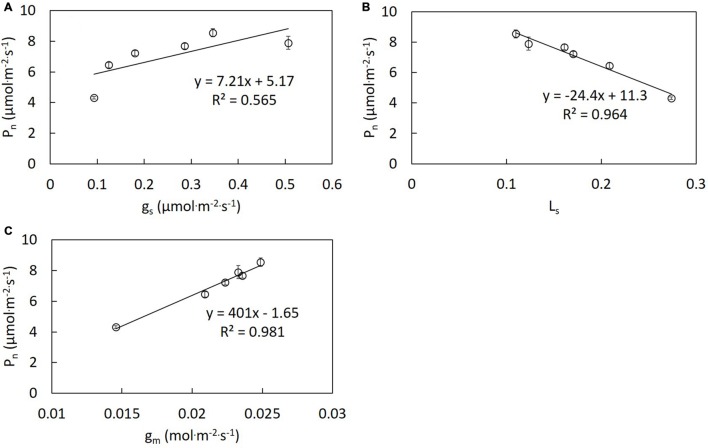
FIGURE 2.
Correlation analysis between Pn and gs (A), Ls (B), and gm (C) of lettuce grown under different R/B ratios treatments. Values were the means of four replicates with standard errors shown by vertical bars. Different letters indicate significant differences using the Duncan’s Multiple Range Test (p < 0.05; n = 4).

