
FIGURE 1.
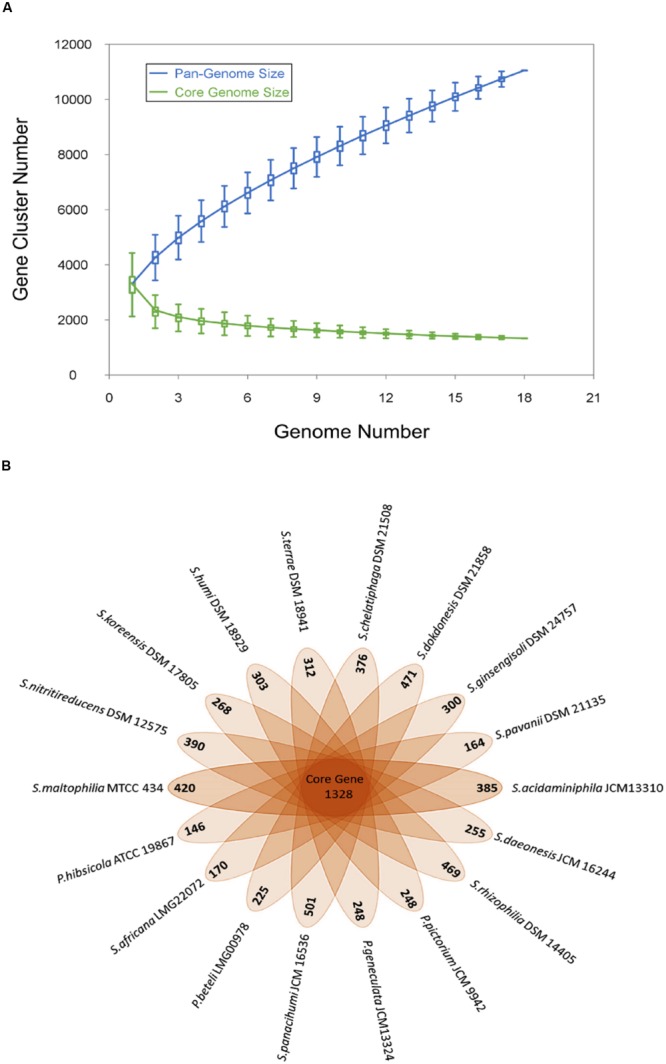
Pan and core genome of the genus Stenotrophomonas. (A) The number of gene clusters in pan-genome and core-genome are plotted against number of Stenotrophomonas genomes sequenced. (B) Flower plot diagram showing numbers of unique genes in each Stenotrophomonas species in the petals and Stenotrophomonas core orthologous gene number in the center.