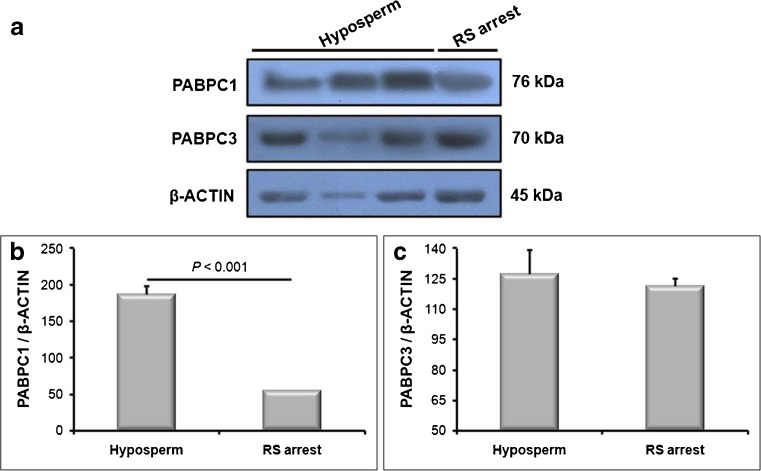
Fig. 6.
PABPC1 and PABPC3 protein expression in the RS fraction. The relative expression levels of the PABPC1 and PABPC3 proteins in the RS fractions isolated from hyposperm and RS arrest groups were characterized using Western blot, and Western blot results were further analyzed using ImageJ software. a Western blot results of the PABPC1 and PABPC3 proteins in the RS fractions were presented. The RS fraction from hyposperm group had higher PABPC1 and PABPC3 expression levels compared to the RS fraction isolated from RS arrest group. b The imageJ analysis revealed that PABPC1 expression in the RS fraction from hyposperm group was remarkably higher than that of the RS fraction from RS arrest group (P < 0.05). c Similarly, RS fraction from hyposperm group exhibited higher PABPC3 expression when compared to the RS fraction from RS arrest group, but it was not found as significant (P > 0.05). The statistical significance among groups was analyzed by using the student’s t-test, and the P value was demonstrated on column using a line chart. Note that P < 0.05 was considered as statistically significant. Data are presented as mean ± SEM

