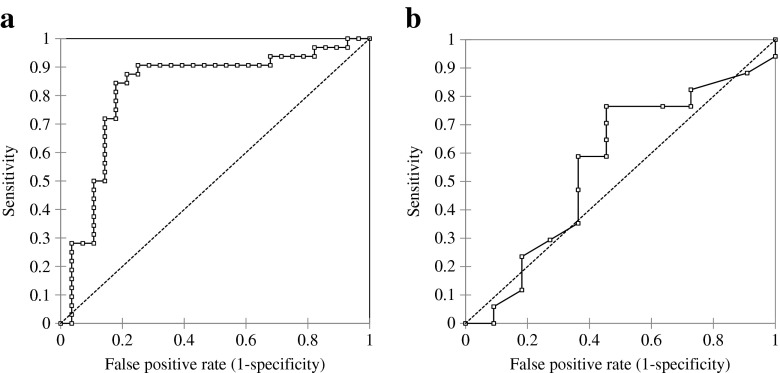
Fig. 3.
Receiver operating characteristic (ROC) curves of mtDNA copy number of CCs and PBCs for the prediction of obtaining good-quality embryos. ROC curves were derived by plotting the relationship between the specificity and sensitivity at various cut-off levels. a The area under the curve (AUC) of CCs was 0.823 (95 % confidential interval [95 % CI], 0.710–0.935). The best compromise between true and false positives was achieved using a threshold of 86 according to the ROC curve analysis. Sensitivity, specificity, positive, and negative predictive values were 84.4, 82.1, 84.4, and 82.1 %, respectively. b The AUC of PBCs was 0.561 (95 % CI, 0.342–0.781). Using a threshold of 12, sensitivity, specificity, positive, and negative predictive values were 76.5, 54.5, 72.2, and 60.0 %, respectively

