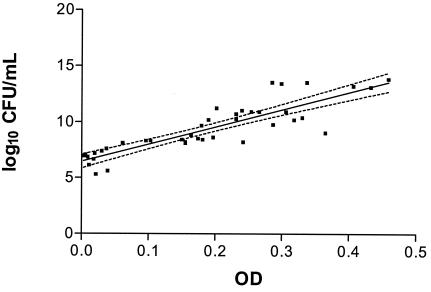
FIG. 2.
Comparison of optical density change over 24 h and final bacterial colony count in microtiter coculture of B. pseudomallei NCTC 10276 with A. astronyxis. x axis, optical density at 450 nm at 24 h of incubation; y axis, log10 CFU of B. pseudomallei per ml at 24 h. Linear regression and 95% confidence limits are indicated (r2 = 0.77, P < 0.0001). OD, optical density.

