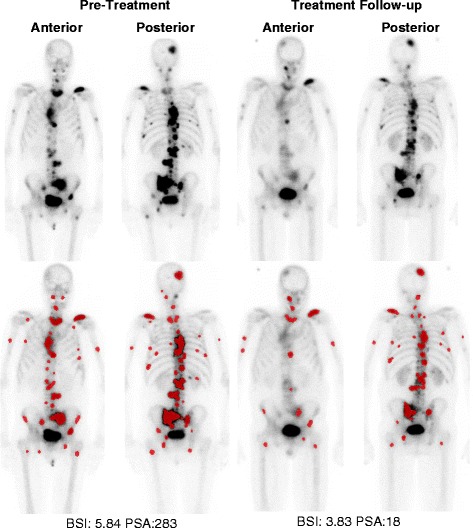
Fig. 2.

Illustrative example of BSI analysis and PSA change after treatment with enzalutamide at 12-week treatment follow-up. Lesions detected and classified as metastatic by the neural network of the automated EXINI platform for BSI calculation are highlighted in red
