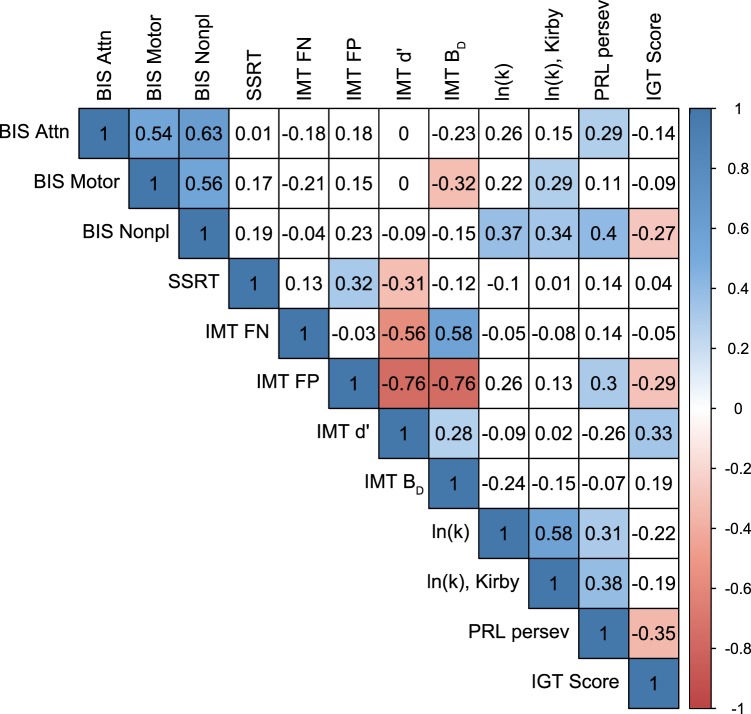
Figure 6.
A correlation matrix between all impulsivity measures. Numbers in cells and color bars indicate Pearson correlation coefficients. Significant correlations (p < 0.05, uncorrected) are filled with blue (positive correlation) or red (negative correlation) colors. BIS, Barratt Impulsiveness Scale; SSRT, stop-signal reaction time; IMT, Immediate Memory Task; FP, false-positive (commission) errors; FN, false-negative (omission) errors; ln(k), natural log of delay-discounting rate; PRL, Probabilistic Reversal Learning; IGT, Iowa Gambling Task.

