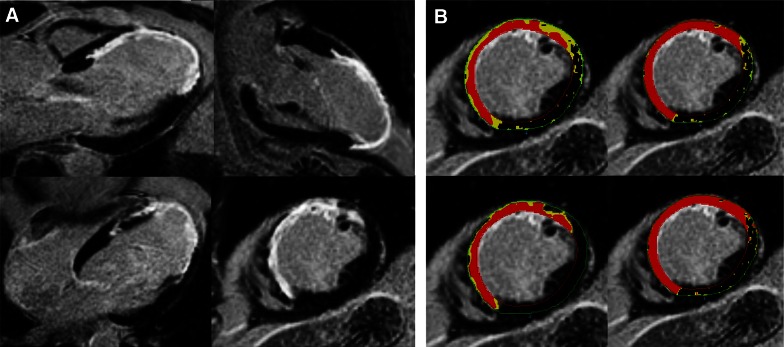
Figure 10.
(A) Example of short and long axis LGE-CMR images in a patient with a large anterior wall myocardial infarction with contrast enhancement visible in the anteroseptal, anterior, and anterolateral wall. (B) Examples of several previously validated quantification methods of the scar core area (red) and scar border zone area (yellow), each resulting in significant a different scar core and border zone size

