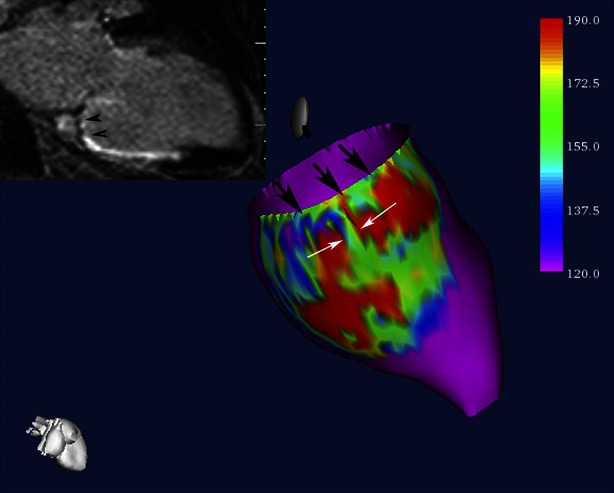
Figure 11.

Example of signal intensity map of the subendocardial tissue projected onto a 3-dimensional endocardial shell reconstruction of the left ventricle. Scar core area with high signal intensity is presented in red, whereas normal myocardium is presented in purple. Black and white arrows indicate two corridors of continuous heterogeneous tissue with intermediate signal intensity (green) surrounded by scar tissue. The left upper corner shows the corresponding long-axis LGE-CMR image with heterogeneous tissue located between the mitral valve and the inferior scar (black arrowheads). CMR, cardiovascular magnetic resonance imaging; LGE, late gadolinium enhancement. Reprint with permission102
