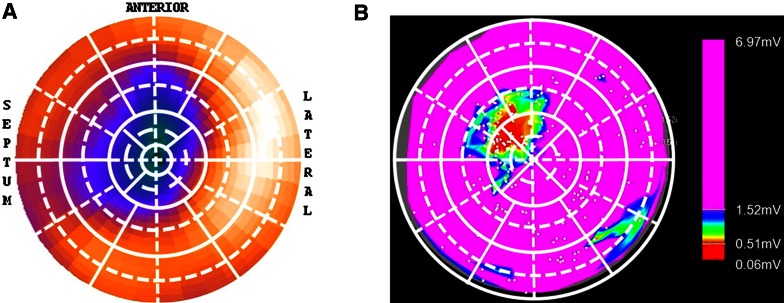
Figure 3.
Example of 201TI SPECT assessed perfusion polar map (A) and corresponding electroanatomic voltage map (B) in a patient with ischemic cardiomyopathy. (A) SPECT polar map demonstrates anteroseptal and apical perfusion deficit which corresponded with the anteroseptal low-voltage scar area (red) as revealed by the corresponding voltage map (B). SPECT, single-photon emission computed tomography. Reprint with permission15

