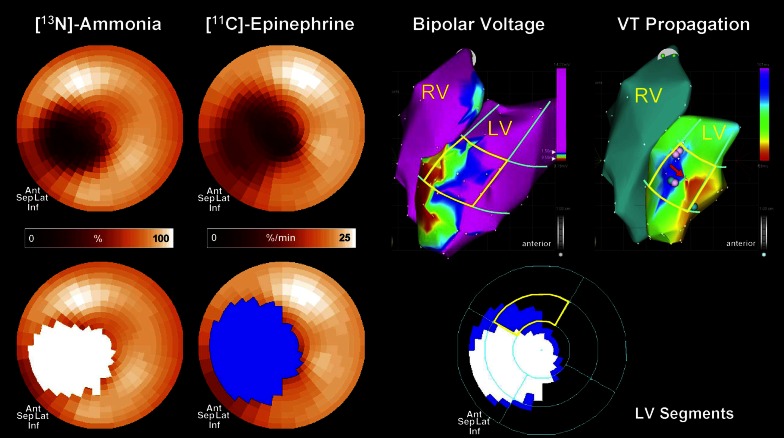
Figure 7.
Electrophysiological study in an animal with inducible VT. PET assessed perfusion and innervation polarmaps demonstrated an innervation defect (blue) which exceeded the size of the perfusion defect (white), predominantly in the distal anterior wall segment (bottom right). Three-dimensional electroanatomic voltage maps (top right) demonstrated reduced voltage in apex and distal anterior septal wall and propagation map showed earliest activation of the VT in the infarct border zone in the distal anterior wall (red arrow), which corresponded with the location of the innervation-perfusion mismatch. PET, positron emission tomography; VT, ventricular tachycardia. Reprint with permission78

