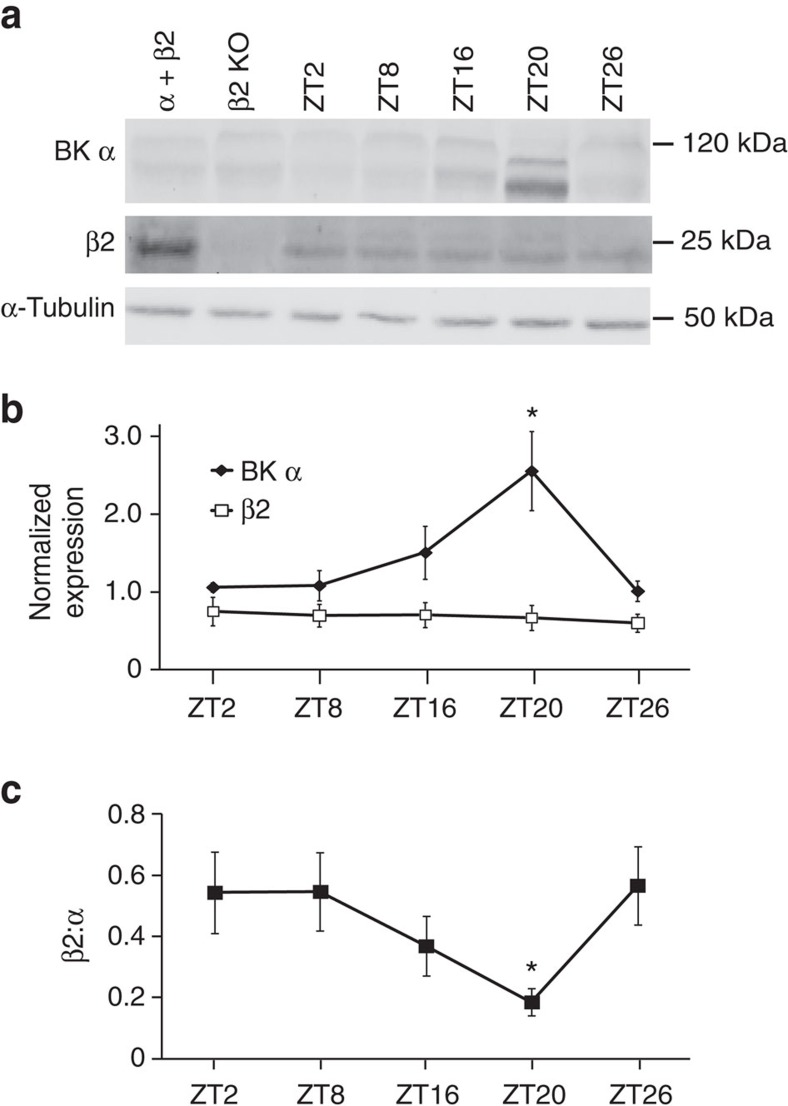
Figure 3. Expression of BK α and β2 in WT SCNs.
(a) BK channel complexes were immunoprecipitated with an anti-BK α subunit antibody from WT SCNs at the indicated time points. Western blot analysis was performed for BK α (top panel), β2 (middle) or α-tubulin (bottom). α-Tubulin westerns (loading control) were obtained by running an equivalent volume of supernatant as was used for the immunoprecipitation. Protein was also harvested from α+β2 subunits co-expressed in HEK293 cells (positive control) or from β2 KO SCNs (negative control). ZT, zeitgeber time. Images have been cropped for presentation. Full size images are presented in Supplementary Fig. 3. (b) BK α and β2 band intensities normalized to α-tubulin. α expression increases at night, while β2 expression does not change. Data are the average from four independent timed SCN collections (four SCNs at each timepoint). (c) Ratio of β2:α expression in WT SCNs across the circadian cycle. All values are mean±s.e.m. *P<0.05, Bonferroni post hoc.

