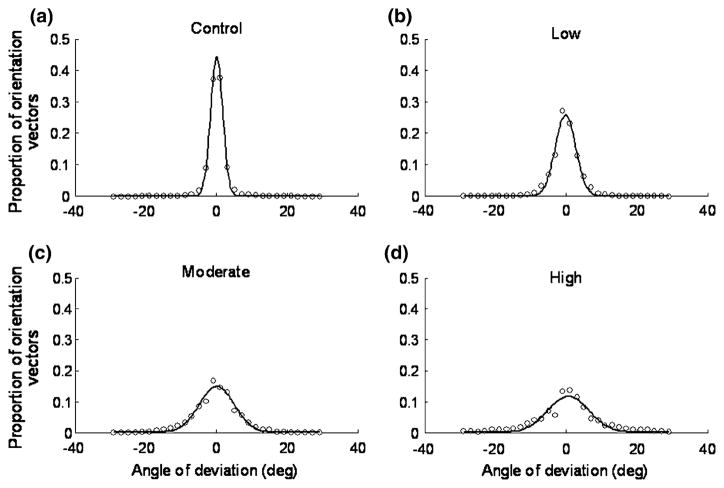
FIGURE 5.
Distribution of local fiber orientation. Angles of deviation representing the mapped vectors for tendons in the control (a), low (b), moderate (c), and high (d) damage levels are tabulated and fitted using Gaussian distribution (with an r2 ≤ 0.954). Distribution of local orientation vectors shows significantly less organization (or anisotropy) from one fatigue level to the next (p ≤ 0.026).

