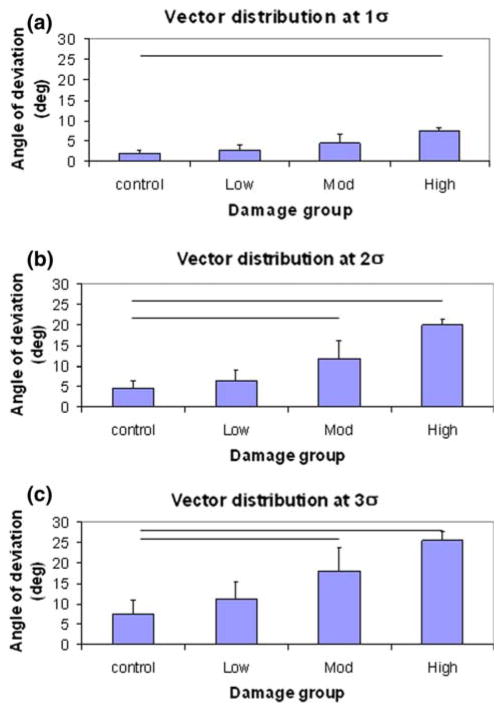
FIGURE 6.
Distribution of local fiber orientations expressed in one (1σ), two (2σ), and three (3σ) standard deviations among the different damage groups. At 1σ (a), significant difference in the angle of deviation is observed between the control and high level damage tendons. At 2σ (b) and 3σ (c), significant difference in the angle of deviation is observed between the control and moderate or high level damage tendons (p ≤ 0.05).

