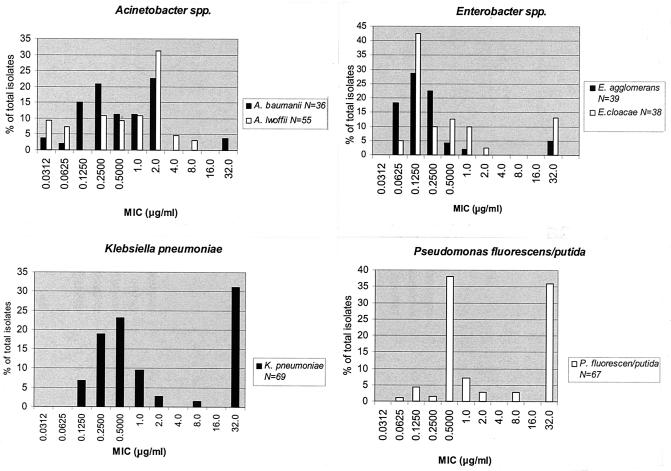
FIG. 1.
Triclosan susceptibilities of representative species found on the hands of both antibacterial and nonantibacterial user groups combined at both baseline and the end of the year. Bars represent the percent of all isolates at the MIC indicated. N, number of isolates tested. The lowest and highest dilutions represent triclosan concentrations of ≤0.0312 and ≥32.0 μg/ml, respectively.

