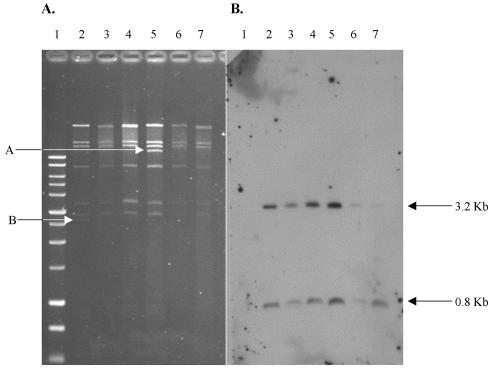
FIG. 3.
(A) PstI digest of serotype Newport type C plasmids. Lanes: 1, 1-kb ladder (Promega); 2, DH/pNF4656; 3, D10/4962 (PFGE group E); 4, DH/5501 (PFGE group A); 5, C6/5561 (PFGE group C); 6, D10/7040 (PFGE group B); 7, D10/7073 (PFGE group A). Arrow A indicates a ∼11- to 12-kb band in C6/5561, and arrow B indicates a 2.7-kb band in DH/pNF4656; these bands constitute the only differences in the plasmid RFLP patterns, as discussed in the text. (B) Subsequent Southern hybridization of the gel in panel A probed with full-length blaCMY-2. Sizes of bands hybridizing to the blaCMY-2 probe, as explained in the text, are given on the right.

