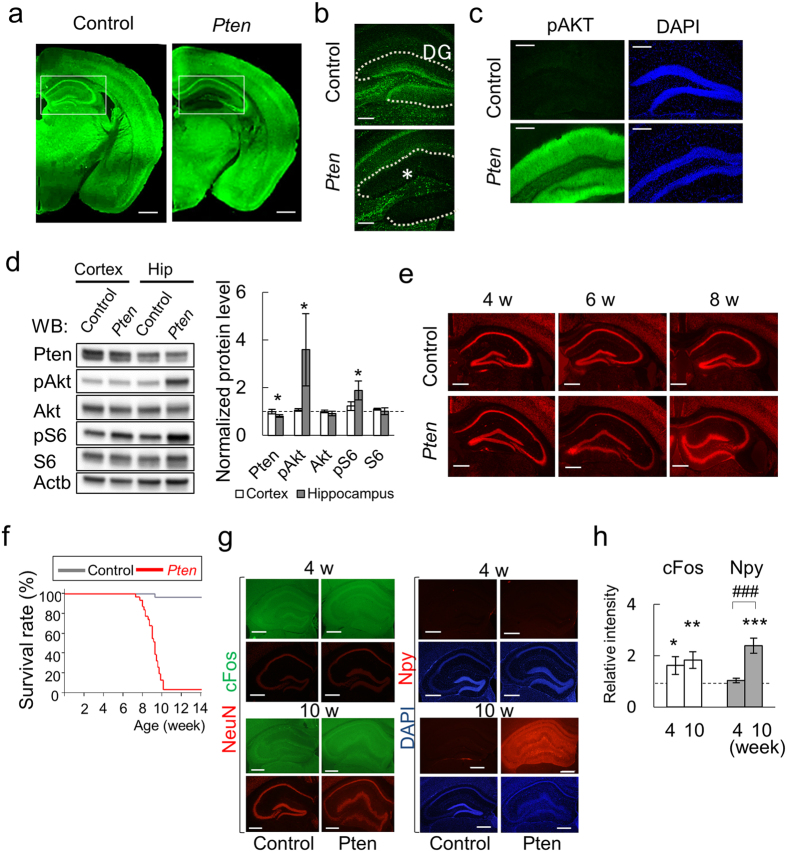
Figure 1. The characteristics and morphological findings of Pten-cKO mice.
(a) Immunofluorescence studies on Pten expression (green). The left two panels show the coronary brain sections from control (left) and Pten-cKO (right, Pten) mice at 4 weeks of age. The squares denote the areas of the hippocampus DG. Scale bar, 1 mm. (b) Confocal images with a higher magnification of the DG. Asterisk indicates the loss of Pten signals (green) in the granule cell layer of DG (dashed lines). Scale bar, 200 μm. (c) Hyperactive AKT signaling in the DG of Pten-cKO mice. The immunofluorescence signals of the phosphorylated S473 of AKT (pAKT, green) and DAPI (blue) are shown. Scale bar, 200 μm. (d) Western blotting of the cerebral cortex and hippocampal extracts from control and Pten-cKO mice at 8 weeks of age. The bar plots for the relative expression levels of the indicated proteins are shown in the right panel. Note that increased pAKT and pS6 signals are seen in the hippocampus, but not in the cerebral cortex of Pten-cKO. *P < 0.05 (n = 4–6, Wilcoxon rank sum test). (e) Progressive hypertrophy of the DG in Pten-cKO mice. The morphological changes of the DG hippocampal sections at the ages of 4, 6 and 8 weeks. See Supplementary Fig. S1 for the whole brain images. Scale bar, 500 μm. (f) Survival rates (%) of control and Pten-cKO mice. (g) cFos (green) and NeuN (red) expression (left panels). Npy (red) and DAPI (blue) expression (right panels), in the DG at 4 and 10 weeks of age. Scale bars, 500 μm. (h) The quantitated results of (f,g). The relative signal intensity (Pten-cKO/control) of cFos and Npy at 4 and 10 weeks are plotted. Asterisks indicate significantly higher levels of cFos and Npy expressions in the DG of Pten-cKO mice in comparison to the control mice. P < 0.05, **P < 0.01, ### and ***P < 0.001 (n = 4–16, Wilcoxon rank sum test).

