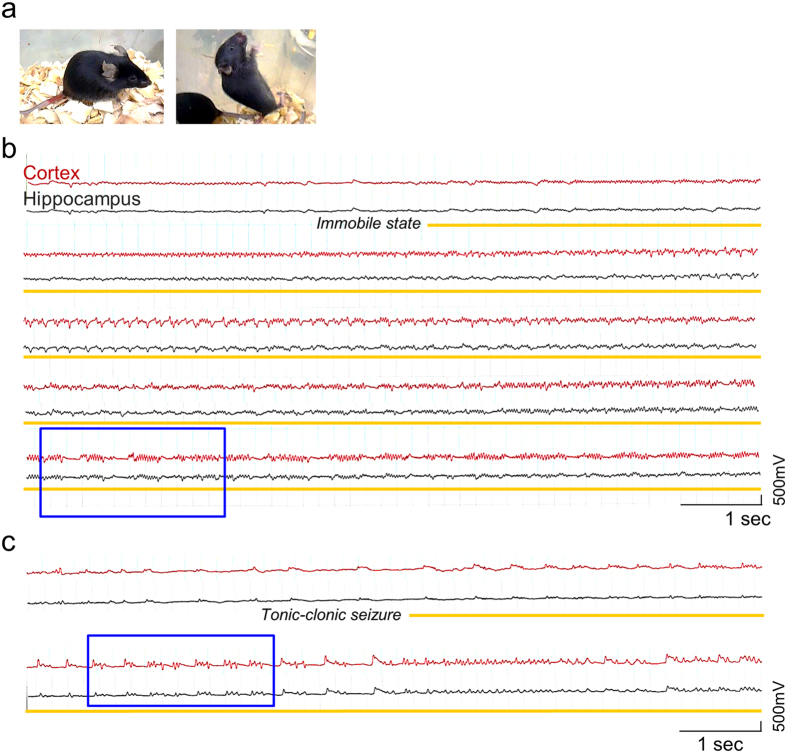
Figure 2. Video-monitored EEG recordings of seizures in Pten-cKO mice.
(a) Pten-cKO mice in static (left) and generalized tonic-clonic seizures (right). (b,c) Representative EEG traces associated with seizures in Pten-cKO mice. Cortical (red) and hippocampal (black) electrodes detected the transition of resting background activity evolving into the paroxysmal phase (yellow lines). Blue squares denote intervals, in which high-amplitude, rhythmic poly-spike (b) or periodic bursts (c) are seen.

