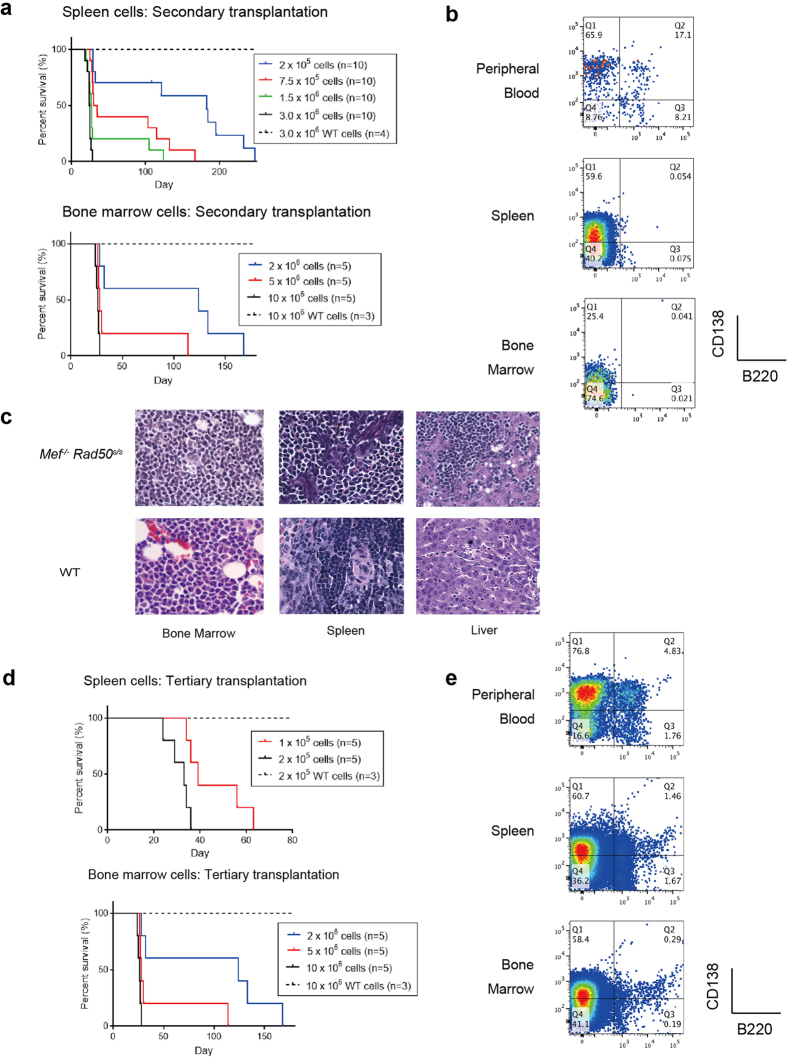
Figure 3. Transplantability of Mef−/− Rad50s/s plasma cell neoplasms.
(a) The Kaplan-Meier curves showing survival after the secondary transplantation of a dose escalating number of spleen and bone marrow cells from tumor-carrying Mef−/− Rad50s/s mice or from wild type control mice. (b) The profile of B220 and CD138 expression in peripheral blood, spleen and bone marrow cells obtained from recipients 3 weeks after the secondary transplantation of Mef−/− Rad50s/s spleen cells. The number shows the frequency of cells in each quadrant. (c) The histology of the bone marrow, spleen and liver are shown in recipients 3 weeks after the secondary transplantation of Mef−/− Rad50s/s or wild type spleen cells, at x600 magnification. (d) The Kaplan-Meier curves showing survival after the tertiary transplantation of a dose escalating number of neoplastic spleen and bone marrow cells or wild type cells from control mice. (e) The profile of B220 and CD138 expression in peripheral blood, spleen and bone marrow cells obtained from recipients, 3 weeks after the tertiary transplantation of Mef−/− Rad50s/s spleen cells. The number shows the frequency of cells in each quadrant.

