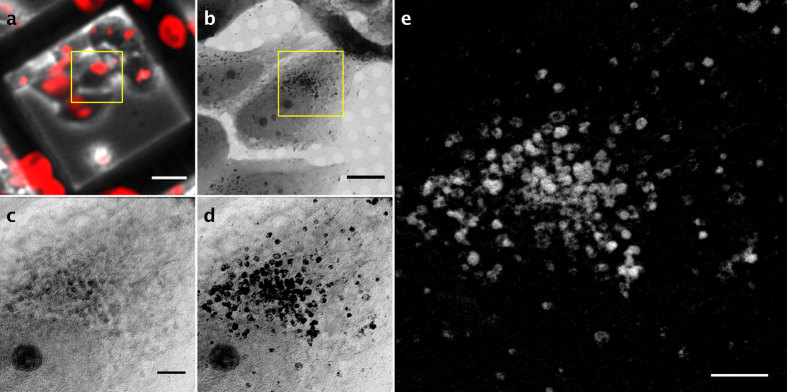
Figure 2. Correlative microscopy and differential tilt-series generation.
(a) In vivo fluorescent image. Acidic organelles are labeled with Lysotracker (red). Scale bar, 25 μm. (b) Soft X-ray mosaic image (709 eV) from the area enclosed in the yellow square in (a). Scale bar, 8 μm. (c,d) 0° projection images of the area enclosed in the yellow square in (b) at 700 (c) and 709 eV (d). (e) Differential 0° projection image containing the SPION signal. Bar in c–e), 2 μm.

