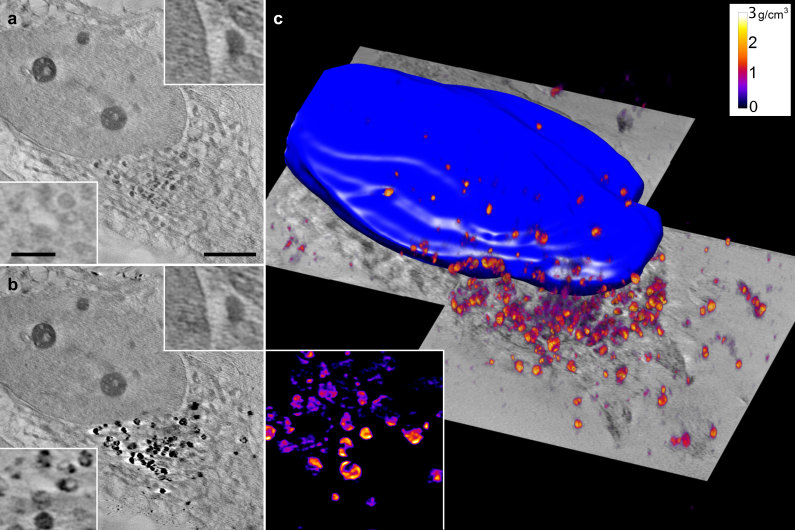
Figure 3. NEASXT slices from reconstructions at 700 and 709 eV and volumetric representation of iron oxide densities.
(a,b) Cellular context resolved by reconstructing single energy tilt-series. Insets show the same regions at different energy. (c) Volumetric representation of iron oxide densities within the cells, forming clusters near the nucleus. The inset shows internal substructures of the clusters in a slice of the volume. Scale bar, 2 μm. Inset scale bars, 0.5 μm.

