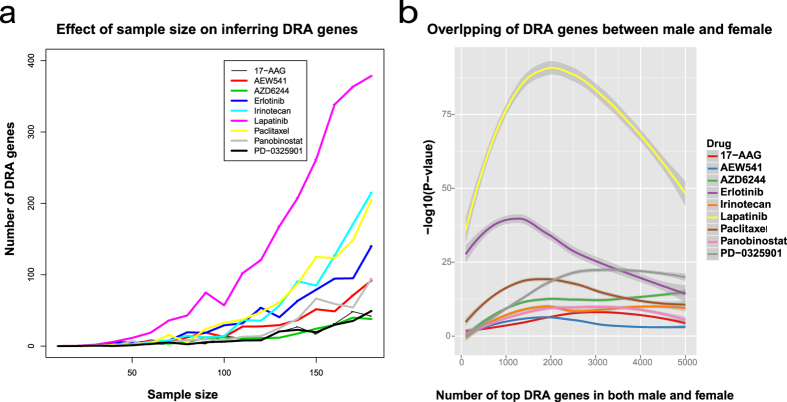
Figure 4.
(a) Effect of sample size on inferring DRA genes (b) Fisher’s exact test on overlapping between male and female sensitivity-associated genes. In (a), X-axis indicates the number of top sensitivity-associated genes selected in both male and female samples. Y-axis indicates the significance of the overlap calculated based on the Fisher’s exact test.

