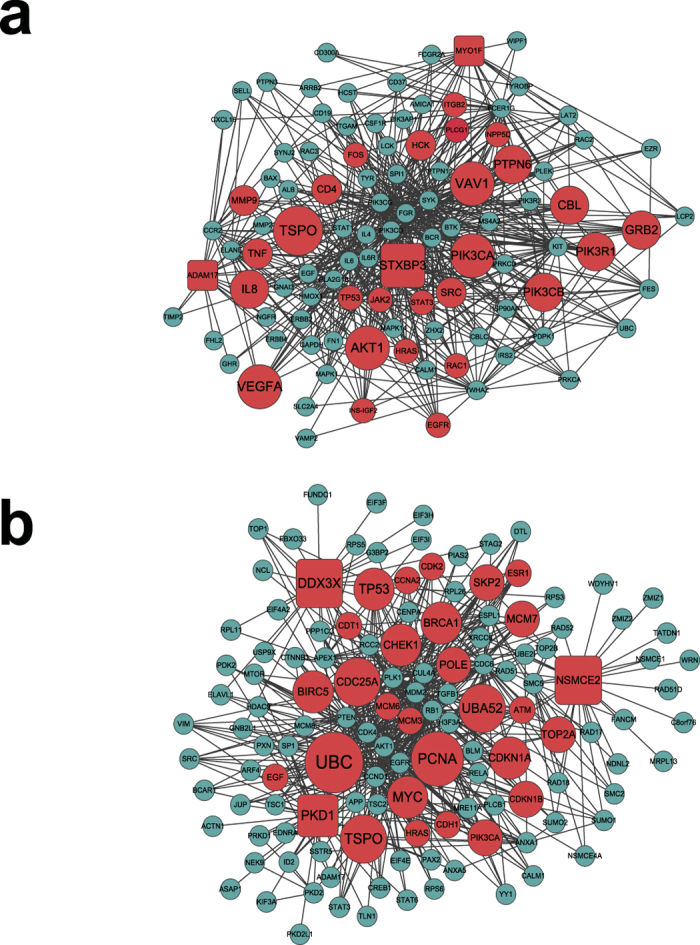
Figure 5.

(a) Network view of genes in module GO:0002444 myeloid leukocyte mediated immunity and their neighboring genes for drug Paclitaxel, (b) Network view of genes in module GO:1901992 positive regulation of mitotic cell cycle phase transition and their neighboring genes for drug Topotecan. We use node shape to denote whether the node is in the module: (1) rectangle represents gene in module; (2) circle represents neighboring gene in the PPI network. We use color to denote whether the node is a key driver: (1) red represents key driver; (2) grey represents other gene.
