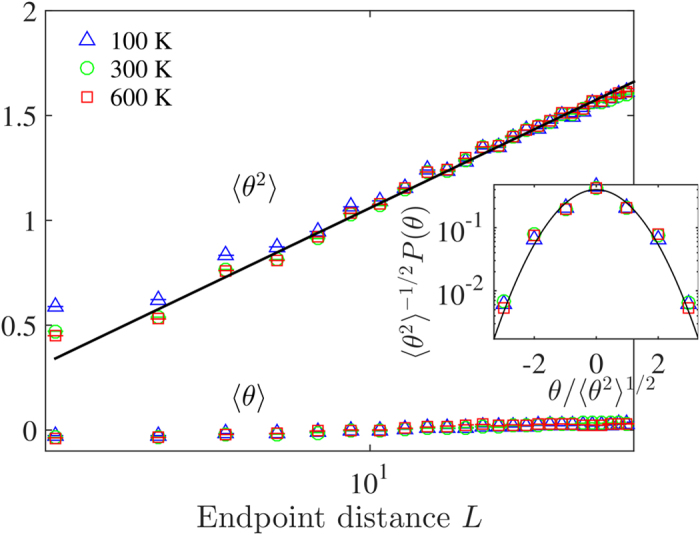
Figure 5.

Main panel: Mean  and variance
  of the winding angle θ of the iso-height contour lines for three different temperatures T = 100 K, 300 K, 600 K, in a semi-log plot. The mean is approximately zero and the variance linear in ln(L). The solid line denotes the best fit. Inset: Rescaled probability distribution of the winding angle for L = 13.37 Å, compared to a folded normal distribution with zero mean unit variance (solid line).
