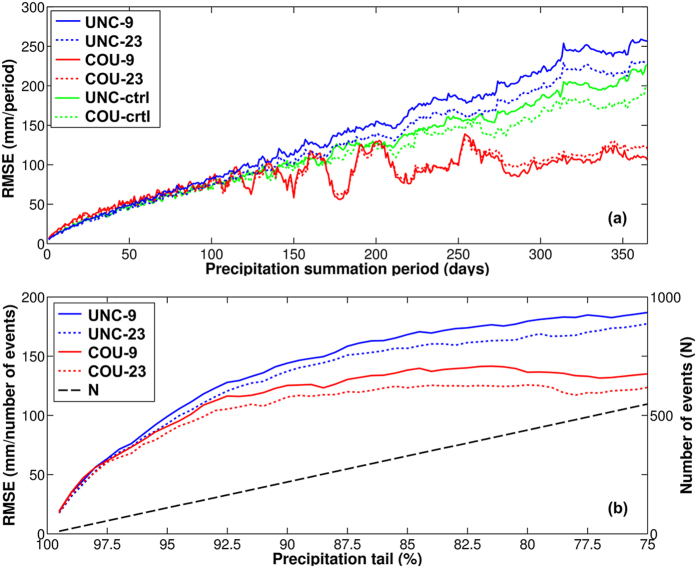
Figure 2. Simulation root mean square error as a function of period length and precipitation intensity.
(a) Root mean square errors (RMSE) of observed and simulated precipitation after summation in periods of 1–365 days for the entire data range and (b) RMSE as a function of the precipitation sum from the 75–99.5% percentile (sorted by observation data) as well as the sample size (N).

