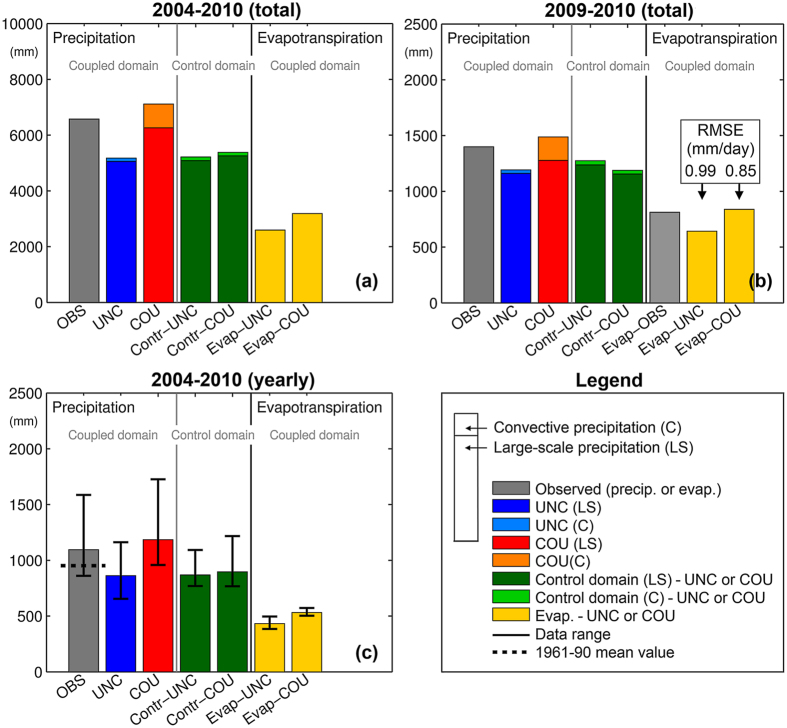
Figure 3. Precipitation and evapotranspiration amounts and variability.
Plots of the observed total precipitation and simulated large-scale (LS) and convective (C) precipitation (stacked to show simulated totals) as well as the simulated and observed (2009–2010 only) evapotranspiration. Results are shown as summation plots for (a) the total period, (b) for the 2009–2010 period and (c) yearly averages (Aug to Jul). Plot (b) includes observed evapotranspiration and corresponding RMSE values for COU and UNC daily evapotranspiration. Plot (c) includes the total observation and simulation range for the six years and the 1961–90 mean (the gauge undercatch is corrected by monthly factors48). Over the coupling domain average levels from the 9 grid cells are shown (UNC-9 and COU-9) and precipitation results are shown for both the coupling domain and the control domain (see Fig. 1).

