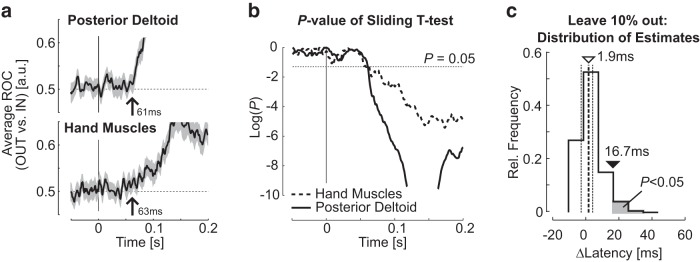
Figure 4.
a, Ensemble average of ROC across participants (mean ± SEM) as a function of time for shoulder (top) and hand (bottom) muscles. Traces were smoothed with a 5 ms sliding window for illustration purposes. Vertical arrows indicate the moment when the sliding t test becomes significant. b, p values of the sliding t test comparing participants ROCs to chance level as a function of time for hand (dashed) and shoulder (solid) muscles. c, Distribution of difference between the latency of goal-directed feedback response in hand and shoulder muscles obtained with 200 repeats of leave-10%-out Jackknife procedure (ΔLatency > 0 means that the shoulder muscle leads hand muscles). Vertical dashed lines represent the median (thick line: 1.9 ms, open triangle) and the interquartile range [thin lines, (−2.5, 4.3) ms]. The 95th percentile of the distribution is represented with the filled triangle. The gray area represents the results less likely than 0.05.

