
Figure 4. Expression of the full lenght FNDC5 protein in gastric mucosa.
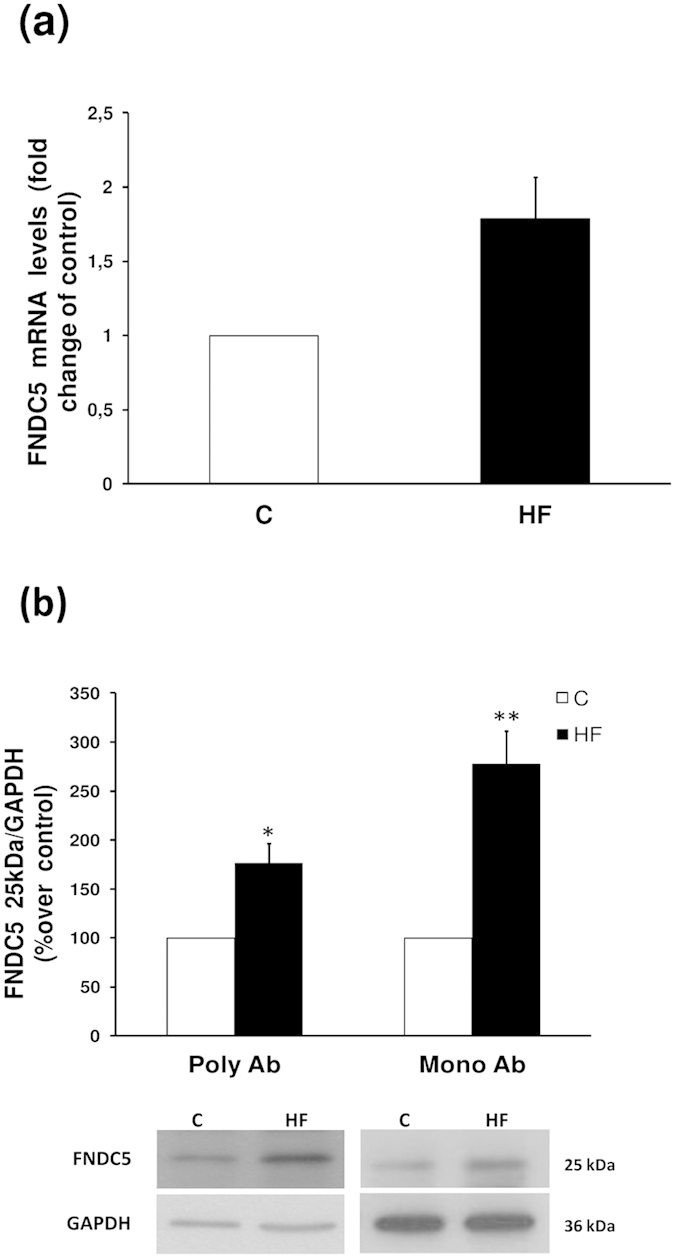
(a) FNDC5 mRNA levels measured by real-time PCR. (b) FNDC5 protein levels and representative western blot images from 25 kDa FNDC5 protein detected with two FNDC5 antibodies (Poly Ab, policlonal antibody; Mono Ab, monoclonal antibody). GAPDH was used to normalize the protein levels. Values are presented as the mean ± SEM. N = 6–8. Error bars indicate the SEM. *P < 0.05, **P < 0.01 vs. Control. C, control; HF, high fat diet.