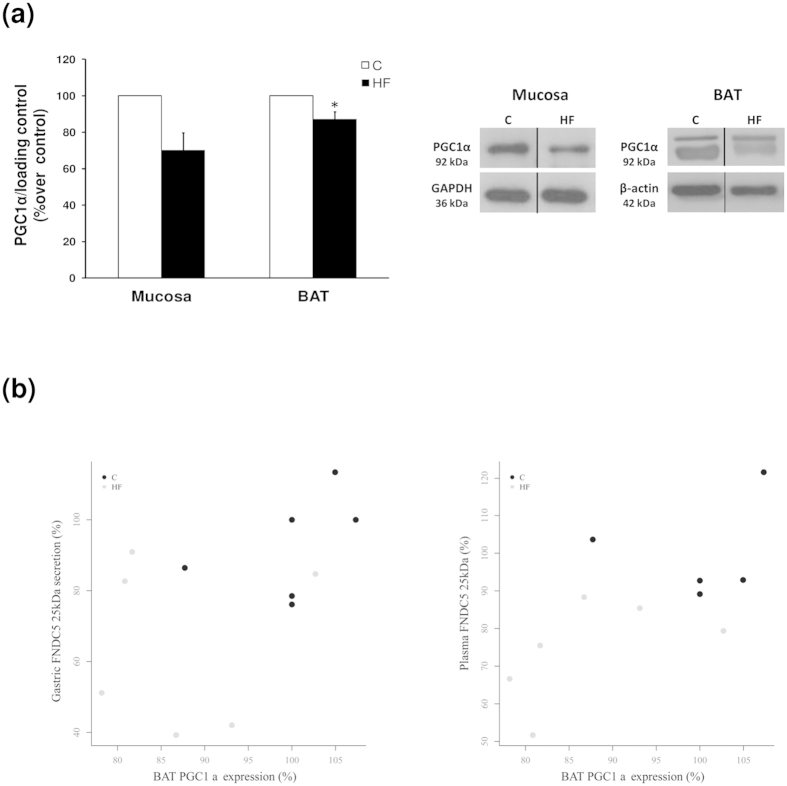
Figure 6. PGC1α expression in stomach and BAT.
(a) PGC1α protein levels and representative western blot images in gastric mucosa and BAT. GAPDH and β-actin was used to normalize the protein levels. Dividing lines indicate splicing of the same gel. Full-length blots are presented in Supplementary Figure 1. (b) Plots of individual data points represent dependency of PGC1α expression in BAT with FNDC5 gastric secretion and circulating levels, showing clearly separated clouds of data points. Values are expressed as the mean ± SEM. N = 6–8. Error bars indicate the SEM. *P < 0.05 vs. Control. C, control; HF, high fat diet. BAT, brown adipose tissue.

