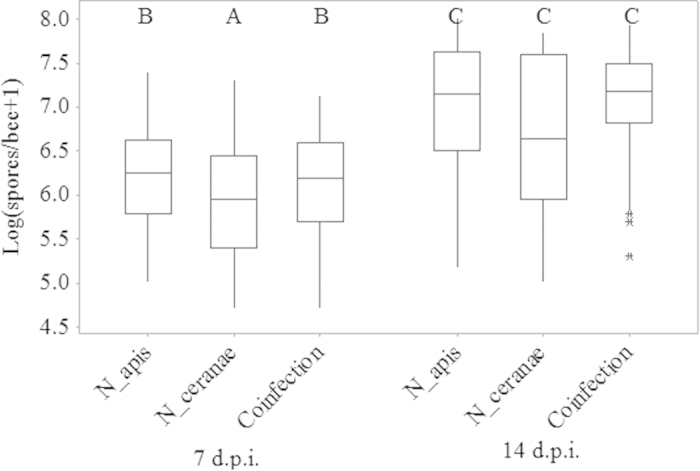
Figure 1. Log-transformed spore intensities in each Nosema treatment at 7 (left) and 14 (right) d post-inoculation.

Sample sizes are given in Table 1. Treatments sharing letters were not statistically different (Mann-Whitney U tests). Boxplots show interquartile range (box), median (horizontal line within box), data range (vertical line above and below box), and outliers (asterisks).
