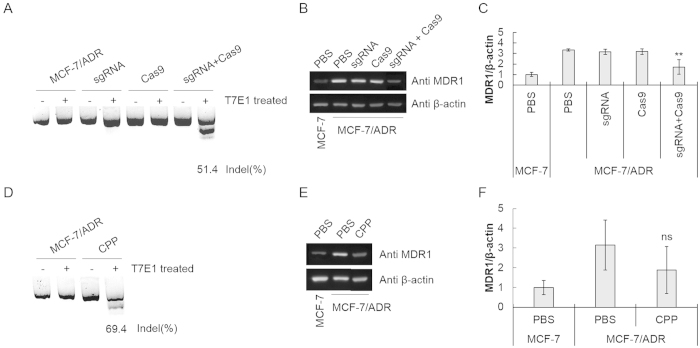
Figure 3. Disruption of mdr1 by intracellular delivery of the Cas9-sgRNA ribonucleocomplex.
(A) The T7E1 cleavage assay to detect the gene disruption and (B) Western blot to measure MDR1 protein levels in MCF-7/ADR cells treated with the Cas9-sgRNA ribonucleocomplex using LF3K. (C) Densitometric analysis of the Western blot was performed for quantitative evaluation of the protein level after normalization by the expression level of β–actin. The data represent the mean ± s.d. (n = 3). **P ≤ 0.01 vs. PBS-treated MCF-7/ADR cell. (D) The T7E1 cleavage assay to detect the gene disruption and (E) Western blot to measure MDR1 protein levels in MCF-7/ADR cells treated with the Cas9-sgRNA ribonucleocomplex using TAT. (F) Densitometric analysis of the Western blot was performed for quantitative evaluation of the protein level after normalization by the expression level of β–actin. The data represent the mean ± s.d. (n = 3). ns P > 0.05 vs. PBS-treated MCF-7/ADR cell.

