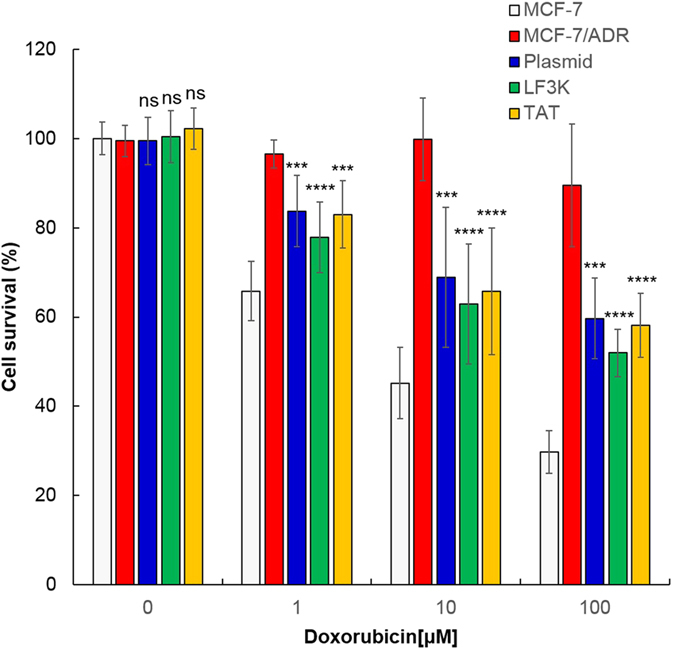
Figure 5. Enhanced potency of DOX in the drug-resistant cells after mdr1 gene disruption by Cas9-sgRNA.

Cell viability of MCF-7/ADR cells at various concentrations of DOX was examined after treatment with Cas9-sgRNA using the plasmid (blue bars), LF3K (green bars) and TAT (yellow bars), and compared with that of untreated MCF-7 (white bars) and MCF-7/ADR cells (red bars). The data represent the mean ± s.d. (n = 7). ns P > 0.05, ***P ≤ 0.001, ****P ≤ 0.0001 vs. untreated MCF-7 cells.
