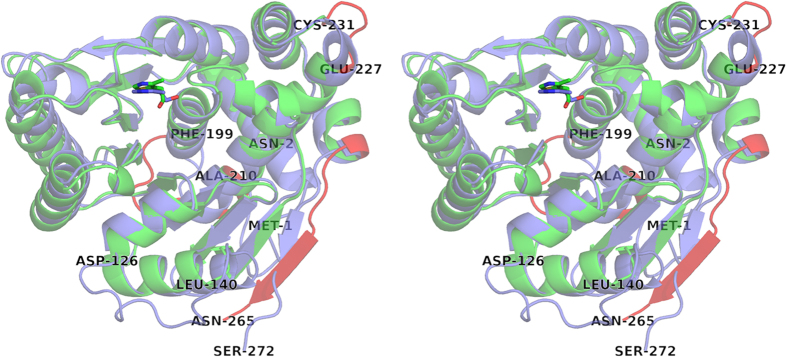
Figure 3. Superimposed structures of SaThim and BsThiK.
Stereo view of the superimposed homologues structures of SaThiM (colored in green) and ThiK from Bacillus subtilis (colored in blue) in a cartoon representation. The regions with higher differences, the loop region from residues 199–210 connecting helix 8 and 9 and close to N- and C-termini, are colored in red. The loop regions 126–140 are not modeled into SaThiM structure.

