
Figure 7.
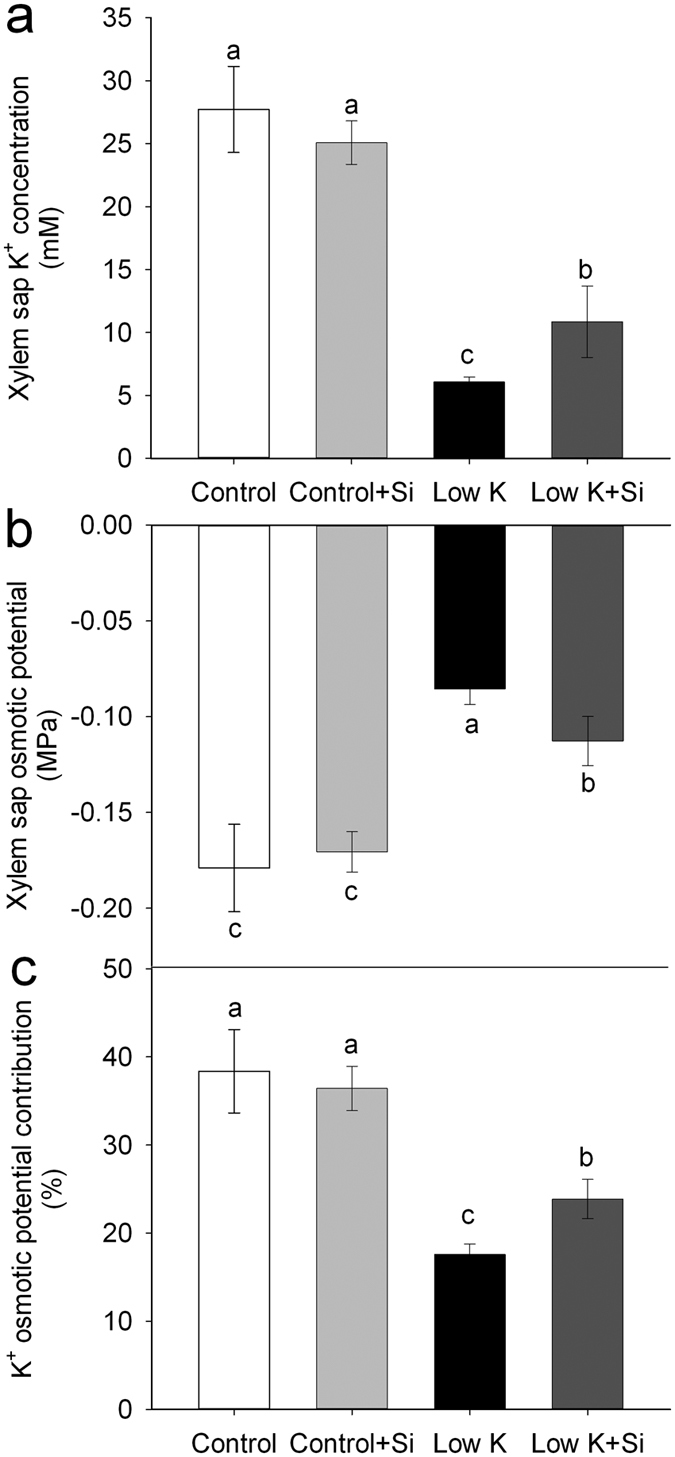
Effects of silicon (Si, 1 mM) on xylem sap K+ concentration (a), osmotic potential (b), and K+ osmotic potential contribution (c) of sorghum plants grown under control (3 mM KCl) and low K (0.05 mM KCl) conditions. All parameters were measured after 15 days of treatment. Values are presented as the mean ± SE (n = 3). Different letters in one measure indicate statistically significant differences at P < 0.05.