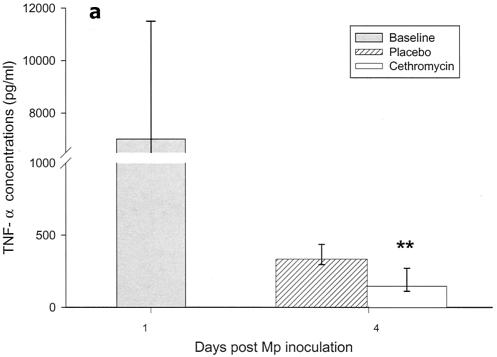
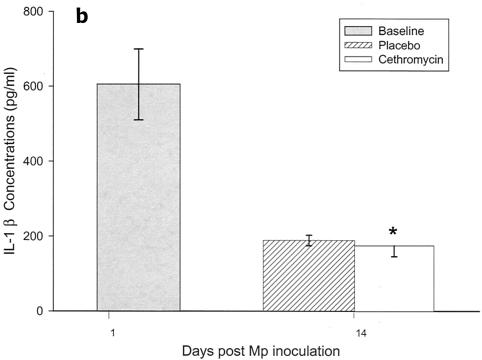
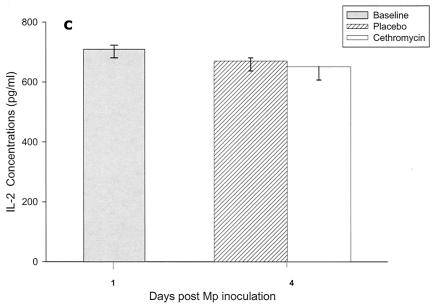
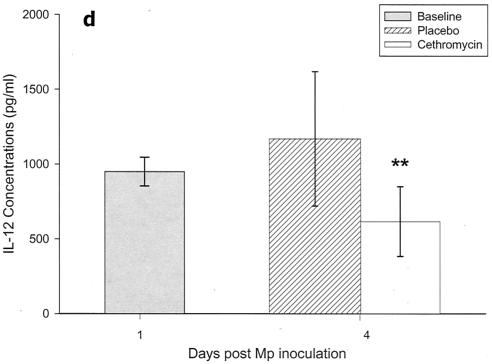
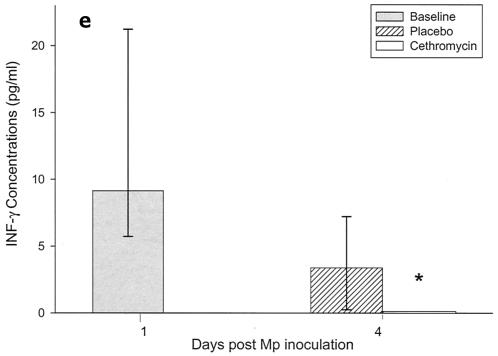
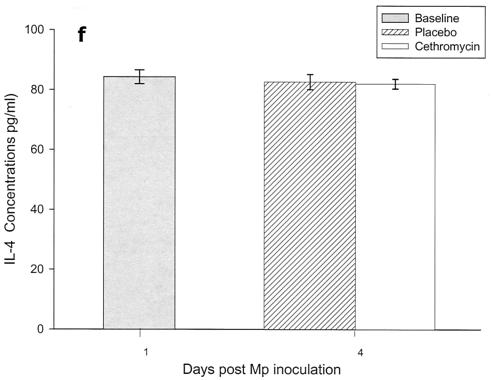
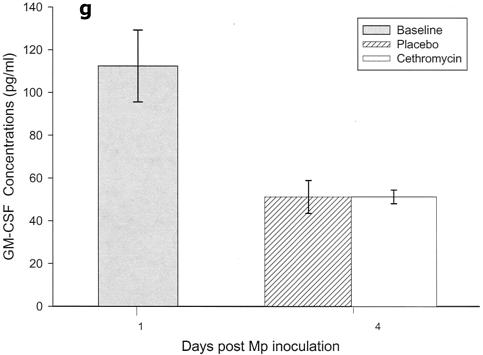
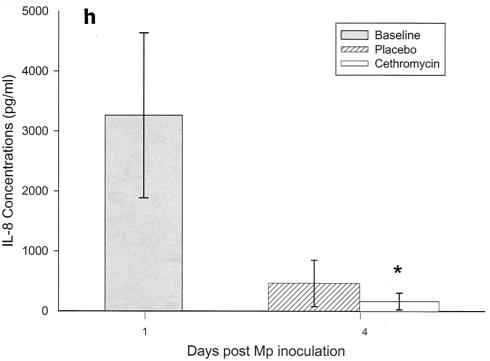
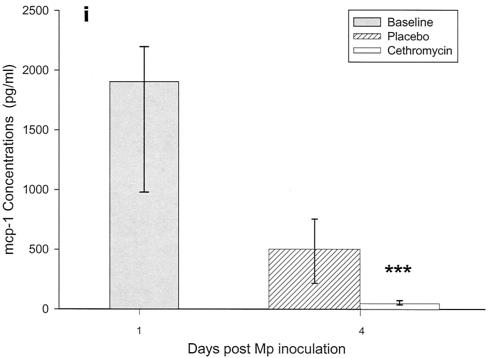
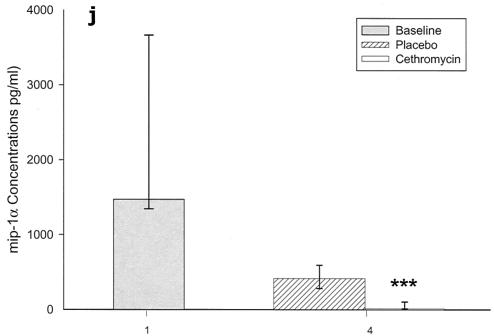
FIG. 3.
(a to j) Mean and median cytokine and chemokine concentrations in BAL fluid of mice infected with M. pneumoniae (Mp) and treated with either cethromycin or placebo. Error bars represent standard deviations when variables have a normal distribution and 75th to 25th percentiles when variables do not have a normal distribution. *, P < 0.05; **, P < 0.01; ***, P < 0.001. n = 5 to 10 mice per cethromycin treatment group and 5 to 15 mice per placebo group.

