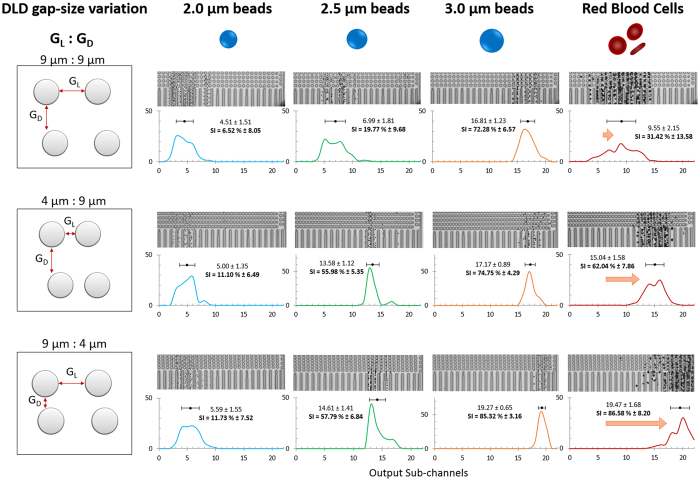
Figure 4. Bead and RBC separation data for asymmetrical DLD gap-size variation.
This figure shows three DLD gap-size variation devices (9:9, 4:9 and 9:4) and their corresponding output separation data for 2.0 μm (blue), 2.5 μm (green), 3.0 μm (orange) and RBCs (red). The horizontal axis is the output sub-channels and the vertical axis is the normalized percentage per output sub-channel. The mean sub-channel position and its corresponding separation index (SI) is calculated from the relative input channels shown in Supplementary Fig. S3, Tables S3 and S4. The sample input stream spans in the region of output sub-channels 1 to 5.

