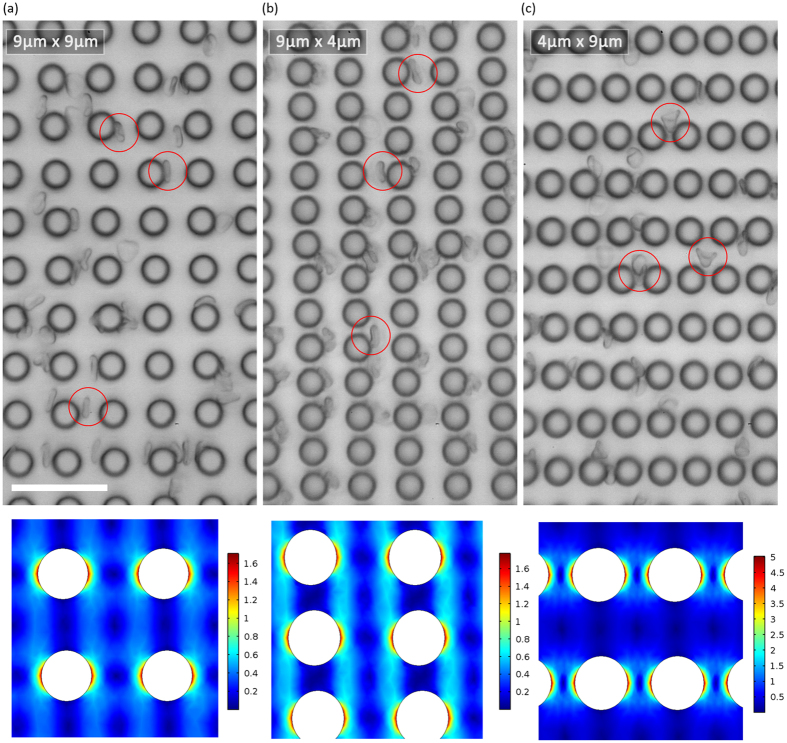
Figure 5. Comparing RBC flow movements within the DLD device.
The figure shows a freeze screen capture of RBC flow movement video within a DLD pillar array (Supplementary Video 1). The respective pillar arrangements are shown for various GL: GD for (a) 9:9, (b) 9:4 and (c) 4:9 DLD devices. The red circles depict the shape of RBC as it flows within these devices. (a,b) show more bi-concave disc shaped RBC while (c) shows deformed cone shaped RBC. The scale bar is 35 μm. According to the Shear stress simulation of 9:9, 9:4 and 4:9 gaps, it can be observed from the scale that 4:9 has the highest shear stress compare to both 9:9 and 9:4 gaps.

