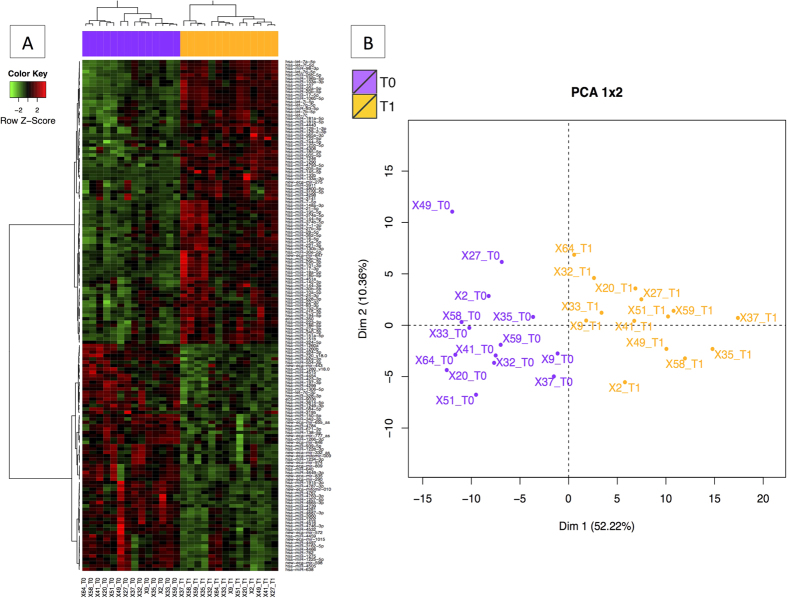
Figure 2. The differential miRNA expression profile in blood.
In all cases, individual horses are represented as violet dots (for T0) and orange dots (for T1). (A) A heat-map representation of the 167 DEmiRNAs when comparing T0 and T1 (FDR < 0.05). (B) PCA of DEmiRNAs in blood when comparing T1 with T0 (FDR < 0.05). The first axis accounted for 52.22% of the variation, and the two axes accounted for 62.58% of the total inertia. The two groups were found to differ significantly in a Monte Carlo test with 999 replicates (p < 0.001).

