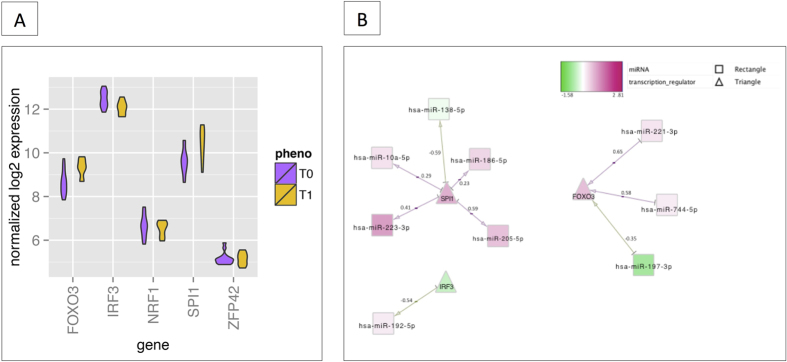
Figure 4. Relationship between TFs, miRNAs and DEGs.
(A) The boxplot graph represents the expression levels (log2) of the main candidate TFs (discovered using iRegulon) within the set of DEGs. ZFP42 was the top regulator, followed by SPI1, FOXO3, IRF3 and NRF1. (B) A schematic view of the common correlations between TFs and miRNAs. The correlation score for expression of the two interactants is indicated under each edge. The network is displayed graphically as nodes (genes, TFs and miRNAs) and edges (biological relationships). The edge colour intensity indicates the expression level of the association: red = over-expression at T1 and green = under-expression at T1. The node shape indicates whether the node is a TF (triangles) or a miRNA (squares).

