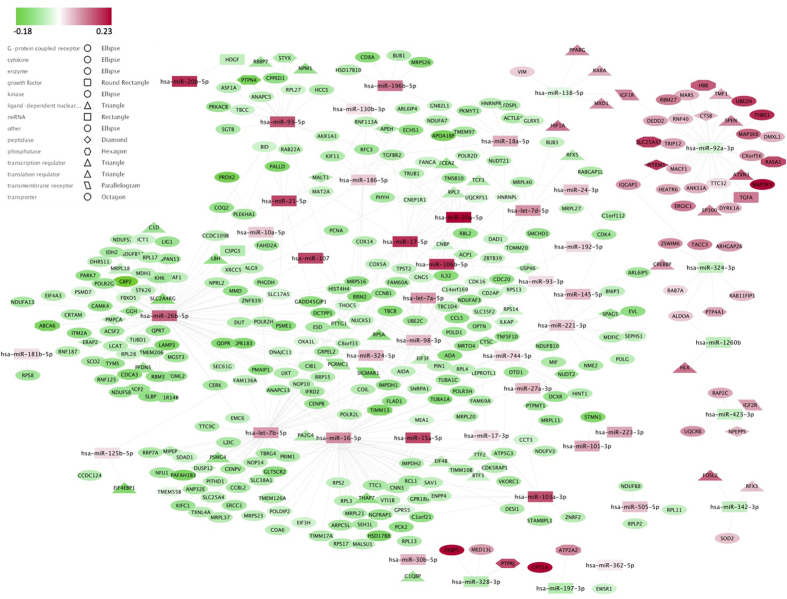
Figure 5. Regulatory network linking the 44 enriched miRNA and their respective inversely correlated target DEGs.
We identified a total of 44 enriched DEmiRNAs for which the miRNA targets defined by multimiR were significantly enriched (according to a hypergeometric test or its generalization). The 44 DEmiRNAs were inversely correlated with a total of 351 unique target DEGs. The network is displayed graphically as nodes (genes and miRNAs) and edges (biological relationships). The edge colour intensity indicates the expression level (log2) of the association: red = over-expression at T1 and green = under-expression at T1. The node shape indicates whether the node is a transcription regulator (triangles), growth factor (round rectangles), peptidase (diamonds), phosphatase (hexagons), transmembrane receptor (parallelograms), transporter (octagons), a miRNA (squares) or other type of genes (ellipses).

