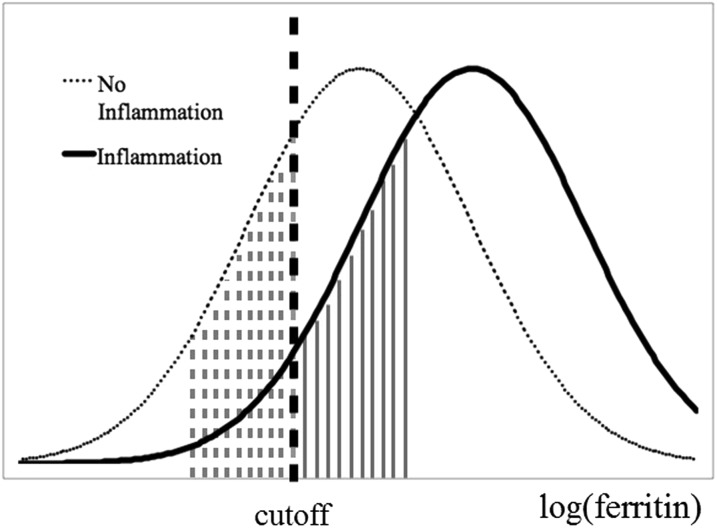
FIGURE 4.
Hypothetical example of serum ferritin concentrations in populations with and without inflammation. A hypothetical population experiencing inflammation will exhibit increased ferritin concentrations shown by the rightward shift of the distribution of log(ferritin). In such a scenario the area shaded with solid lines represents the portion of the population misclassified as having sufficient iron stores while experiencing inflammation. These individuals would be correctly identified as having insufficient iron stores (and fall in the dashed line shaded area) if ferritin samples were taken when the population was not experiencing inflammation.

