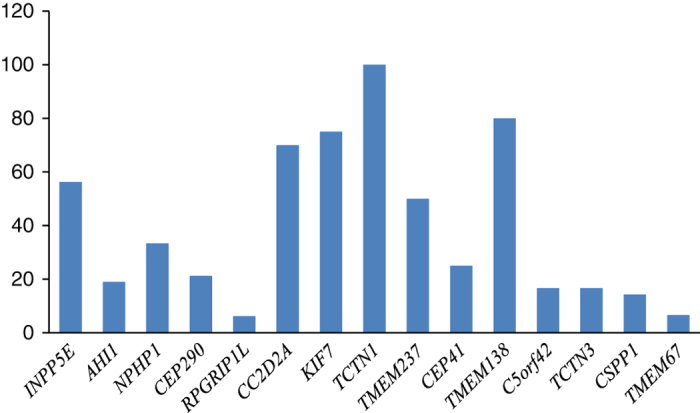
Figure 3.

Percentage of reported mutations in Arab populations per total mutations in each gene. The bar chart represents the percentage of mutations reported in this study and extracted from the HGMD database (http://www.biobase-international.com/product/hgmd) in Arab populations per total reported mutations in each gene individually.
