Figure 2.
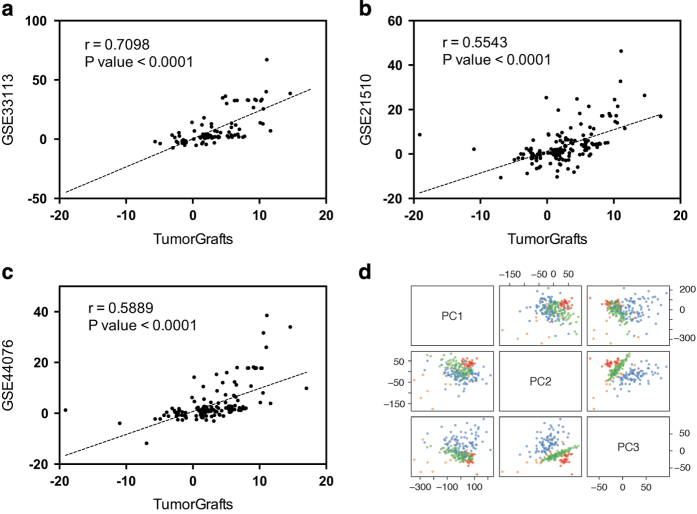
Correlation of pathway activation profiles in CRC tumorgrafts and primary colorectal tumors and principal components analysis. Compared with normal colorectal tissue, significantly upregulated or downregulated pathways were identified based on PAS values (P value<0.05). The PAS values of tumorgrafts correlated significantly with the PAS values of primary colorectal cancer patients in all three cohorts tested: (GSE33113, a), (GSE21510, b) and (GSE44076, c). Principle component analyses (PCA) were performed to assess the variation and clustering between PAS of tumorgrafts and primary CRC patients (GSE44076), and the first three principal components are shown (d). Each sample is represented by one dot. Samples from tumorgrafts (red dots) and the primary CRC data set (GSE44076) (green dots) are overlaid. One set of lung cancer (GSE30219, blue dots) and melanoma (GSE7533, orange dots) samples were also plotted as references. The mean Euclidean distances between the colon cancer tumorgrafts group and the human colon cancer, lung cancer and melanoma groups are 41.43, 79.95 and 124.65, respectively.

