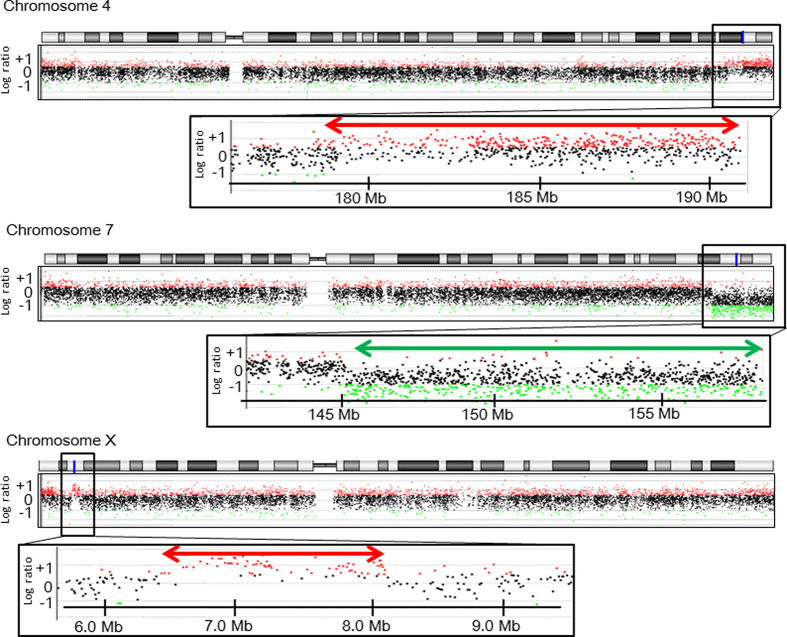
Figure 1.
Cryptic copy-number variations (CNVs) in the patient. The black, red and green dots denote signals indicative of the normal, the increased (log ratio⩾+ 0.5) and the decreased (log ratio⩽−1.0) copy-numbers, respectively. Genomic positions correspond to the human genome reference assembly (UCSC Genome Browser, hg19, build 37). The red and green arrows indicate the duplicated and deleted regions, respectively. The names of the genes affected by the CNVs are shown in Supplementary Table S1.

