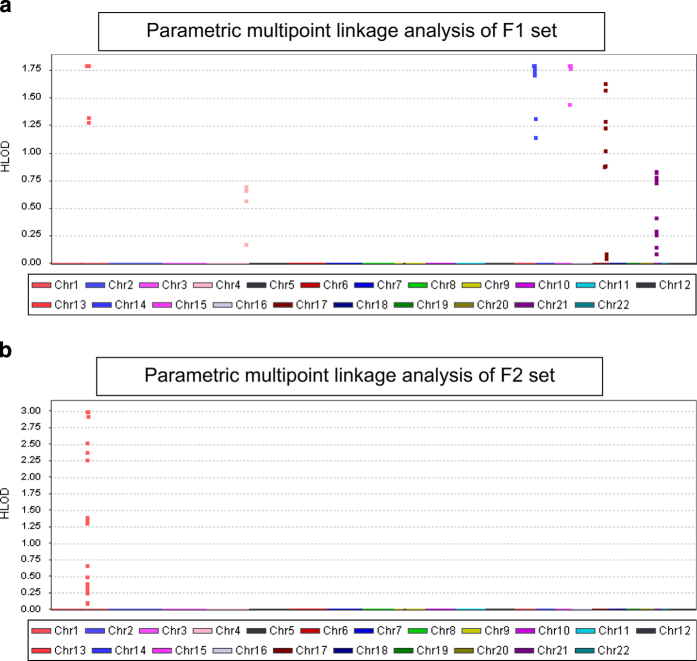
Figure 3.
Parametric multipoint linkage analysis of the Chinese family. (a) Linkage analysis of the F1 set mapped the disease locus to 4 regions on chromosomes 1, 14, 15 and 17 with peak LOD scores >1. (b) Linkage analysis of the F2 set mapped the disease locus only to chromosome 1. Each dot shows the LOD score at each SNP.

