Figure 1.
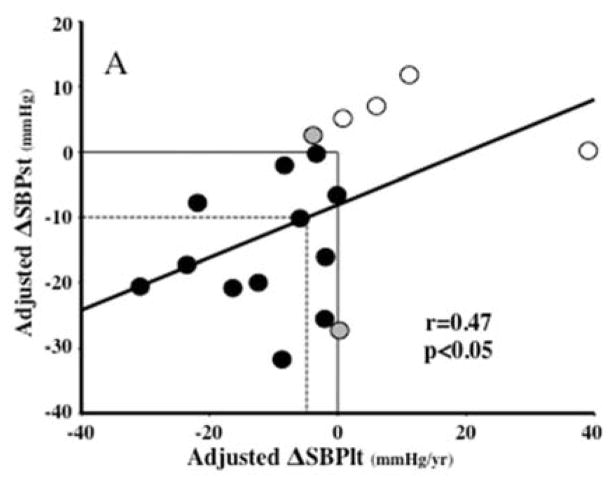
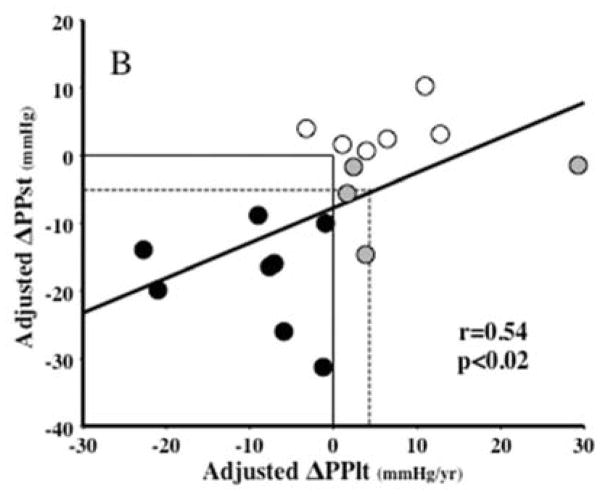
Regressions of the short-term changes in systolic (panel A, ΔSBPst in mmHg) and pulse (Panel B, ΔPPst) pressures on the long-term slopes of these parameters (ΔSBPlt and ΔPPlt, mmHg) over the entire period of follow up, all adjusted for covariates as explained in Methods. In Panel A, black dots represent the 12 subjects with concomitant decreases and white dots the 4 subjects with concomitant increases in ΔSBPst and ΔSBPlt. The two subjects represented by gray dots had minor increases in ΔSBPst but minor decreases in long-term slopes. The dotted-line square encompasses 6 subjects with reductions in SBPst ≥10 mmHg. The vertical projection from the intersection between the ΔSBPst= −10 mmHg and the regression line to the x axis shows that an SBPst reduction of 10 mmHg predicts a slope of −4.8 mmHg/yr. In panel B, 14 out of the 18 patients had a concordant change in adjusted ΔPPst and ΔPPlt; 8 sustaining decreases (black dots) and 6 sustaining increases (white dots). The other four patients exhibited an initial reduction in PP that was not sustained on a long-term basis (grey dots). Six of the 10 subjects encompassed by the dotted lines in this panel (representing an −5 mmHg ΔPPst) were the same six subjects with SBPst fall ≥10 mmHg in panel A. R and p represent the Pearson’s correlation coefficients and their statistical significance. The regression lines are for all data analyzed together.


