
Figure 3. IP3Rs and remodelling of focal adhesions in PANC-1 cells.
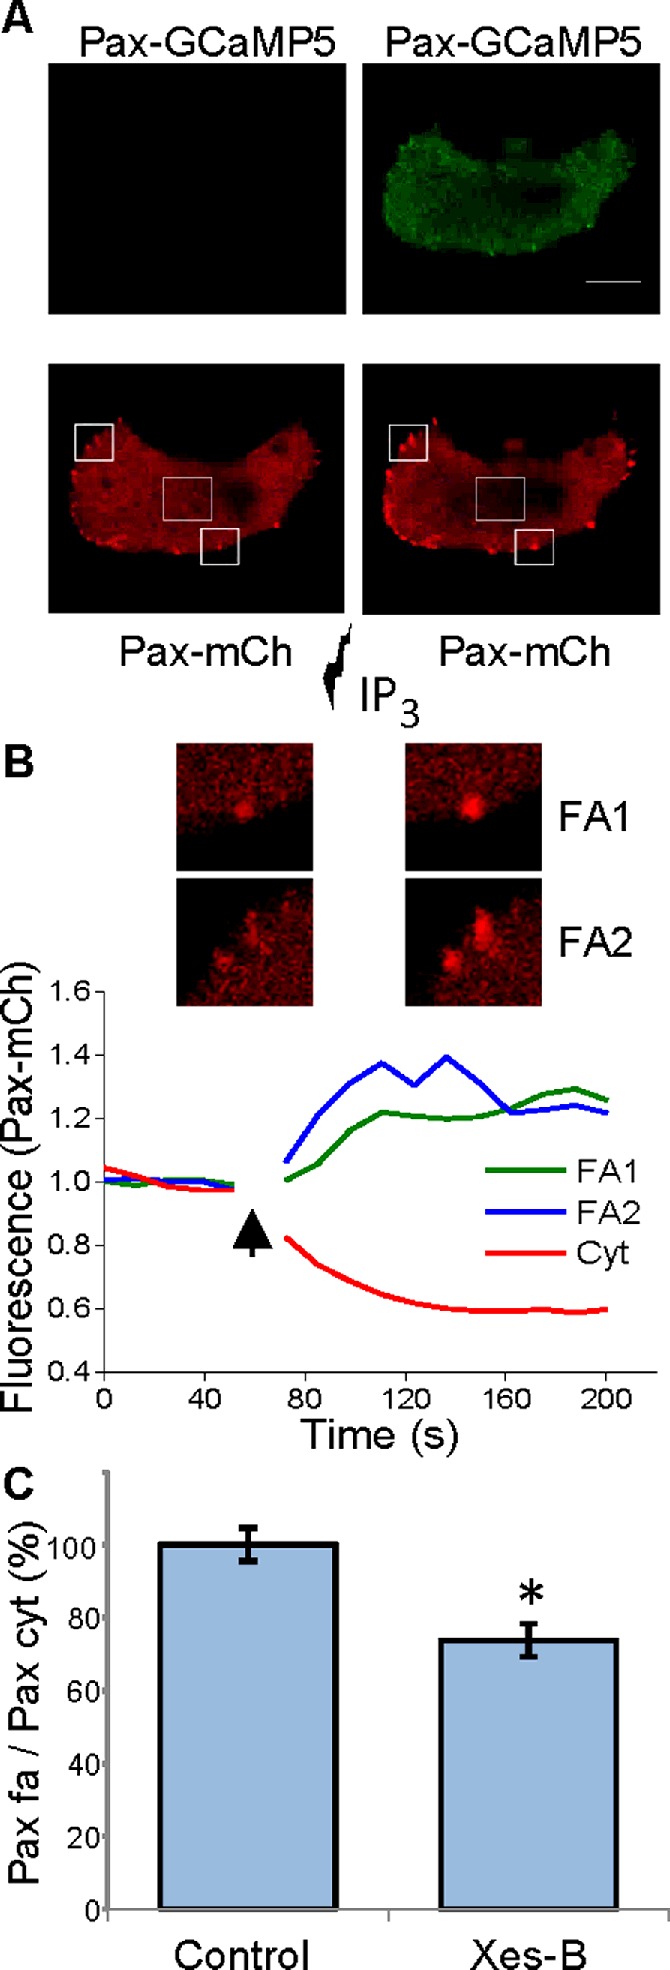
(A) IP3 uncaging induces paxillin accumulation in focal adhesions. Upper panels show the fluorescence of Pax-GCaMP5 before (left) and after (right) uncaging. The increase in GCaMP5 fluorescence indicates a Ca2+ rise; note the prominent response in focal adhesions. The lower panels show the distribution of Pax-mCh fluorescence before (left) and after (right) IP3 uncaging. Note the prominent increase in fluorescence in focal adhesions induced by the uncaging. (B) The graph shows the increase in fluorescence (i.e. Pax-mCh accumulation), recorded from the regions of interest containing focal adhesions (shown above the traces and highlighted by solid border boxes in A), and the decrease in Pax-mCh fluorescence in the cytosol (the region of interest for this analysis included the area of cytosol highlighted by dashed border box in A). The arrow indicates the period of uncaging (during this period the fluorescence recording was interrupted). The images are fragments of the cell shown in (A). (C) Xestospongin-B (Xes-B) produced a statistically significant decrease in paxillin content in the focal adhesions of unstimulated cells (i.e. cell are not treated with IP3-generating agonists). In these experiments cells were stained with anti-paxillin antibodies. The fluorescence of focal adhesions was normalized by the fluorescence of the cytosol. The normalized fluorescence of paxillin in focal adhesions was measured in untreated cells (control, n=39) and in cells incubated with xestospongin-B for 1 h (n=32). The results for both groups are shown as mean values ± S.E.M.