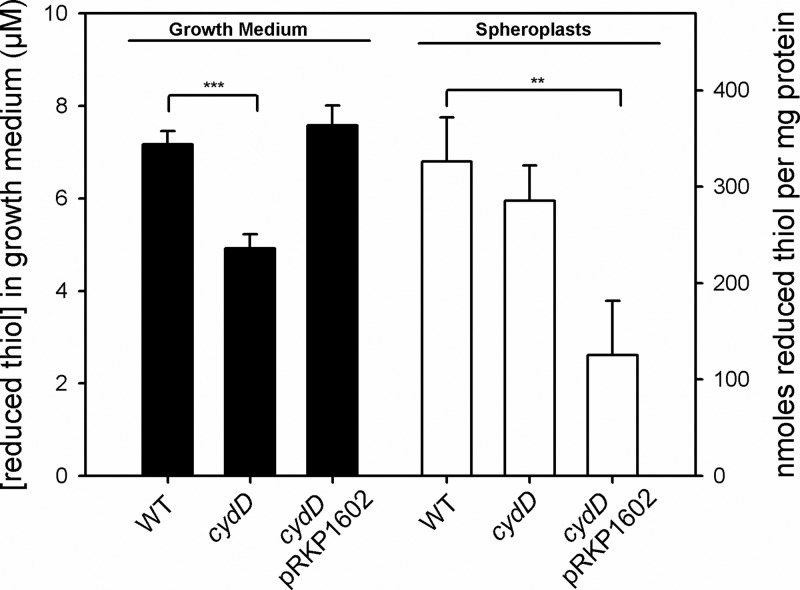
Figure 1. Influence of CydDC upon extracellular and intracellular reduced thiol concentrations.
DTNB assays were used to quantify extracytoplasmic and cytoplasmic reduced thiol levels when CydDC expression was varied. Wild-type and cydD mutant strains were grown along with a cydD strain complemented with the pRKP1602 vector encoding cydDC downstream of the native promoter [9]. The average OD600 values at which cells were harvested were all within the range 0.37–0.39. The concentrations of reduced thiols in growth medium (black bars) and spheroplasts (white bars) correspond to the left hand and right hand axes, respectively. Mean values of three repeats with error bars showing S.D. are shown, and t tests demonstrate significant differences between indicated datasets at the 99% (**) and 99.9% (***) levels.

