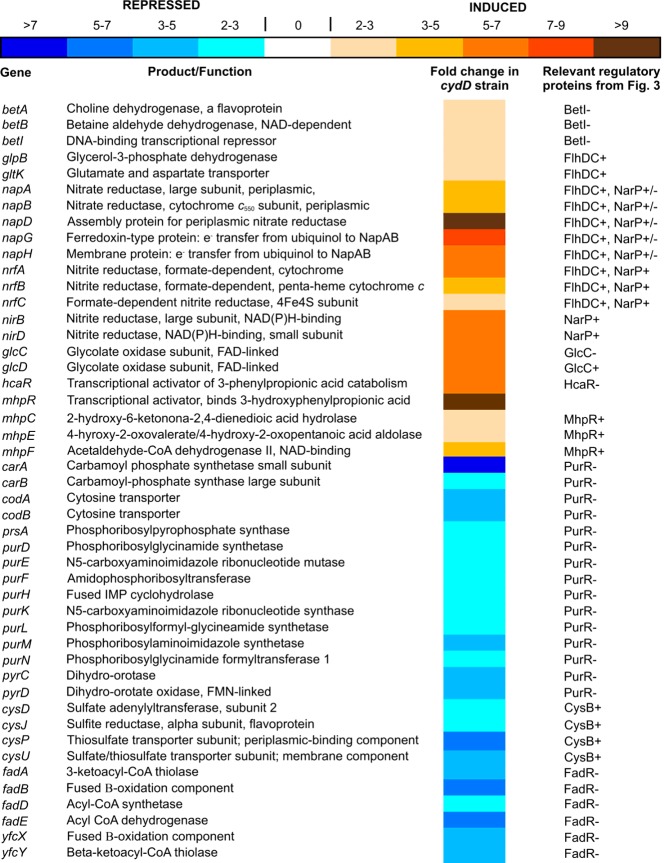
Figure 4. Differential expression of genes in a cydD strain, under the control of BetI, CysB, FadR, FlhDC, GlcC, HcaR, MhpR, NarP and PurR.
The mean fold increase or decrease in individual gene expression in a cydD strain compared to wild-type controls is indicated by the colour scale bar. Functional annotations were taken from the Ecogene and RegulonDB websites.

