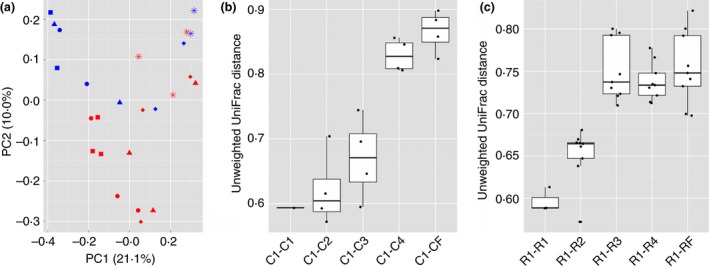
Figure 1.

Principle coordinate analysis and unweighted UniFrac distances relative to step1 diet. Principle coordinate analysis of unweighted UniFrac distances between four step‐up diets and the finisher diet during corn‐adaptation and RAMP‐adaptation programs (a). Unweighted UniFrac distances relative to step1 were used to identify shifts in bacterial community composition between subsequent steps (compared using Mann–Whitney U tests) in the adaptation programs. A single shift in the community composition was identified between step3 and step4 during corn‐based adaptation (b) while two earlier shifts, step1 to step2 and from step2 to step3, were detected during RAMP‐adaptation (c). C1–C4 represents adaptation steps during corn‐based adaptation; R1–R4 represents adaptation steps during RAMP‐based adaptation. CF and RF represent corn‐ and RAMP‐adapted animals on the same finisher diet, respectively. ( ), C1; (
 ), C2; (
 ), C3; (
 ), C4; (
 ), CF; (
 ), R1; (
 ), R2; (
 ), R3; (
 ), R4; (
 ), RF.
